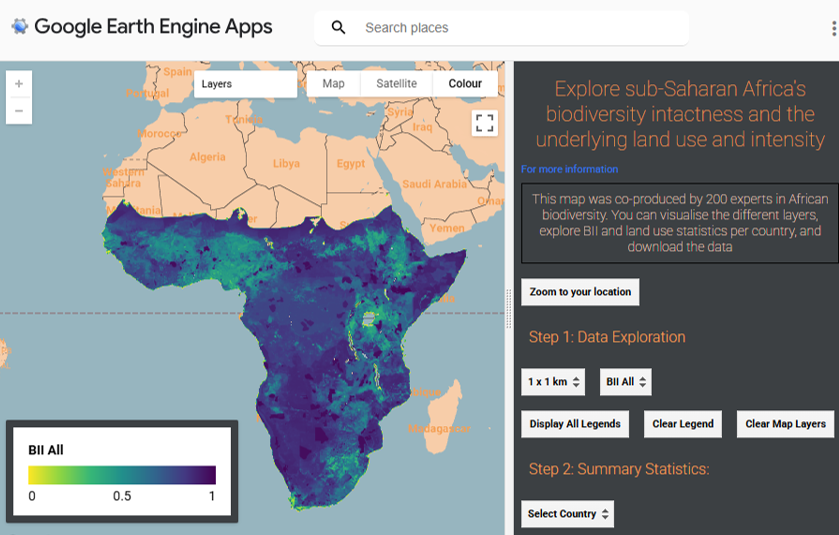
Assessment of the intactness of sub-Saharan Africa’s ecosystem functions based on the BII
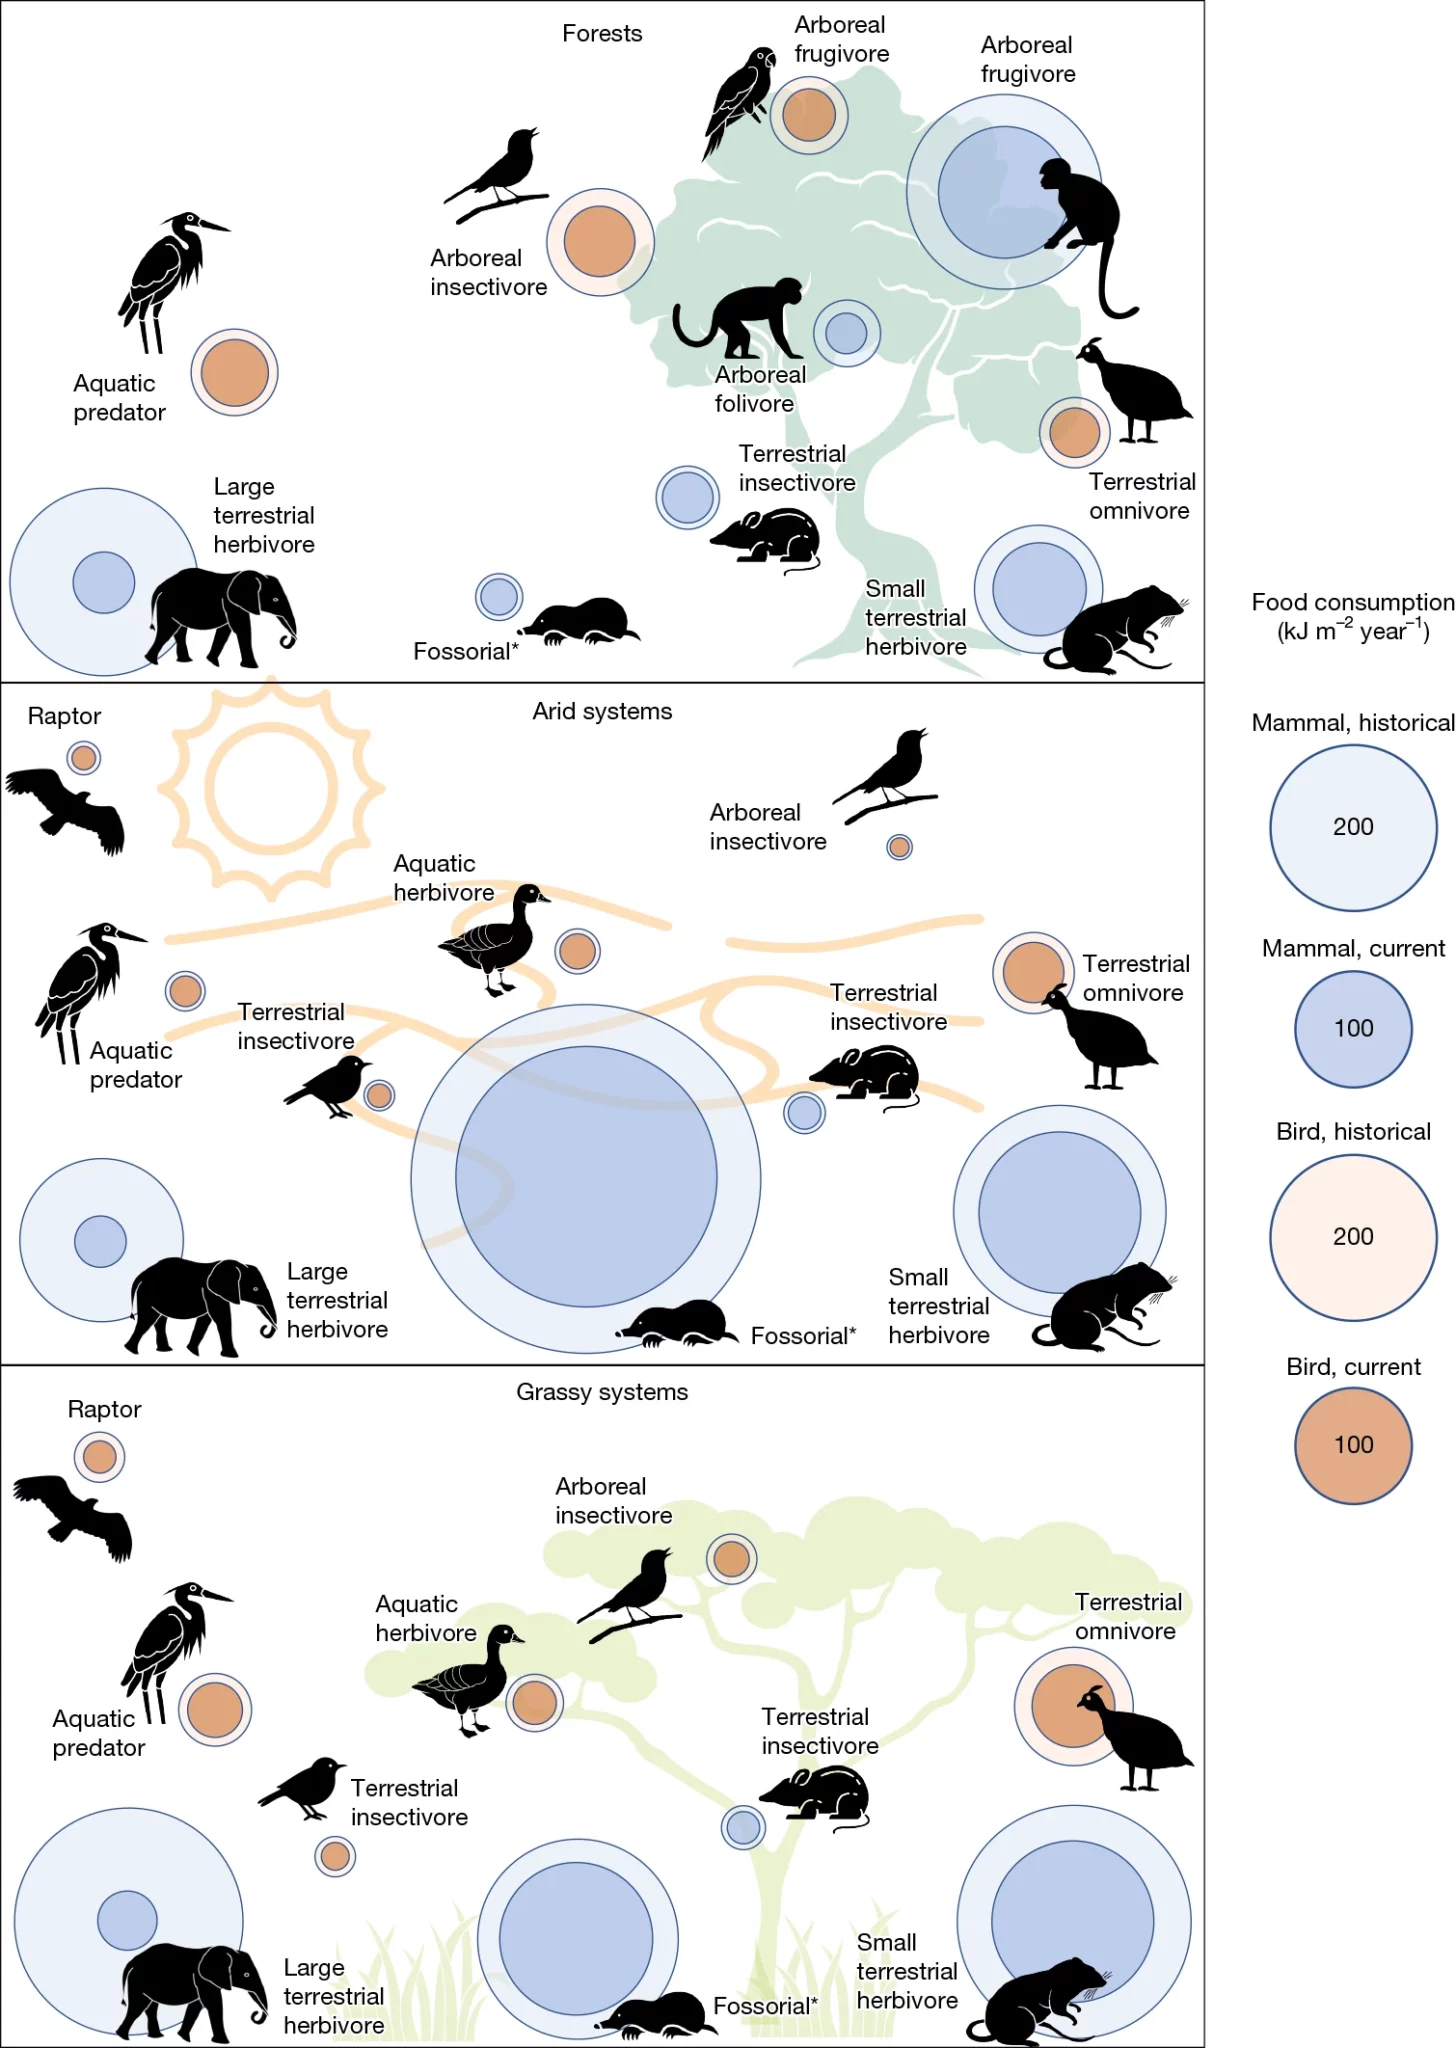
We used an “ecosystem energetics” approach to quantify how energy flows through food webs—from sunlight captured by plants to the animals that consume it. Using